This is not a Pharo post at all, instead it’s a story of an overheating laptop. Actually, it’s mostly for my future reference in case I would need to do something similar ever again. But if you are interested in system logging, pretty graphs, and dirty fans then read on. :)
Lenovo are (allegedly) notorious for insufficient thermal management, but I’ve never had too many issues, as I rarely utilize the machine to it’s full extent (I have 16GB RAM, and yet right now only 450 MB is in use… not even 3%). However, I also had the machine for about four or five years, so brokeness slowly accumulates.
Long story short, recently I started having serious issues as the machine started shutting off due to overheating even on a relatively low load. So maybe it would be a good idea to take it apart and clean it up, especially the fan (which hasn’t been cleaned in four years).
But one thing bothered me: how would I know if anything I am about to do will actually help? Sure, I can make some observations like… the fan isn’t so loud, or it’s not shutting off (as much), but that’s anecdotal at best.
So, first I had to decide how would I know if anything change… well, logging to the rescue.
Creating RRDTool database
After some googling, I’ve found a great tool called RRDTool that easily allows logging metrics. So I’ve decided to log the CPU usage, and temperature of the core as those were the primary culprints. In retrospect I forgot to also mesure GPUs which was a mistake, but we learn every day. Don’t forget that next time!
So how do we start using RRDTool? The first thing you need to do is to create a database that will hold the data:
|
|
The number 120 should generally be higher than step — if no data is entered during this period, then it considers them to be zero. As I didn’t plan to have logging outages, I didn’t really care about the value.
RRA:MAX:0.5:1:1500:
MAX- if multiple updates occur during a singlestep, only the highest value will be used.0.5- internal RRDTool value1- if we stored multiple steps, we could average overN1500- max number of expected datapoints, as I was running it only for a short time it doesn’t matter much; 1500 × 5 seconds (step) = ~2 hours is more than enough time.
Now once we have the database, we want to update it; that’s very simple:
|
|
One thing to keep in mind is that RRDTool does not like having concurrent updates. Originally I had one script that was logging temperature, and the other CPU usage, and the data got all weird… you have to do it in one step.
Collecting data
Now for the collection itself… figuring out the temparature on linux is as trivial as cating a file. (Note that the temperature is in microcelsius for whatever reason.)
|
|
As for the CPU, I was surprised to find out that it’s rather tricky, as there is no global pool that would keep this information, and the only way to figure it out is let the script run for a while and average over the period.
Thankfully, with the magic of StackOverflow and some adjustments, this was resolved
|
|
Couple things to note:
- I’m calling
read_statfrom a subshell, therefore the function cannot modify global variables - Likewise because bash cannot return multiple values, I have to split them
- Bash doesn’t support floats, so
bcto the rescue - Start with sleep, so enough time passes for correct CPU usage computation
we stitch it all together
|
|
Now to let it run for a while… or we can help it a bit as I wanted to see how the machine behaves under full load (which in theory shouldn’t be catastrophically straining for a properly working machine).
So I wrote a simple script that fully utilizes one core (I have a quad core)… the first thing that came to mind was an inneficient implementation of a fibonacci.
|
|
So now I can launch the script 0 to 4 times to utilize 0, 25, 50, 75, and 100% of the CPU.
Plotting the data
After playing around and collecting some data I wanted to actually show them, so I used the plotting part of RRDTool:
|
|
All --* parameters above are optional, but recommended. In particular --start will by default start 1 day ago, which isn’t useful if you are looking at recent (or old) data… so you can specify a certain time (as I’ve done), or something like --start end-10minutes to start ten minutes ago.
The plotted lines are pretty self descriptive, you just specify the name of the dataset in the database, a label, and a color. Oh and the type MAX should match what you have in the database too.

Pre-analysis
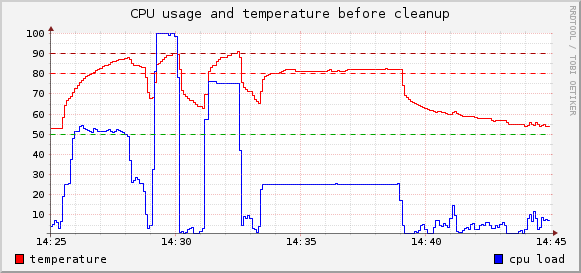
As the machine is willing to shut-off at temps around 90°C (even though critical is considered 98°C) I didn’t want to push my luck, so I stopped the python scripts when they reached this level.
The graph itself is pretty self descriptive:
- 90°C is reached within seconds on 100% (the whole 100% segment is only a minute for safety reasons)
- 50% utilization can also go over 90°C if given enough time
- even low utilization (25%) pushes it to average 81.5°C
- the machine never cools down under 50°C
Certainly more experiments could have been conducted, but this gave me a baseline what to look for after I take the machine apart and put together again — I have a bunch of scripts that I can run again and compare.
Cleanup
Armed with enough nerves to take it apart (it’s currently the only machine I have, so I wouldn’t want to brick it), and several helpful guides I’ve spent over two hours slowly and carefully going through the guts.
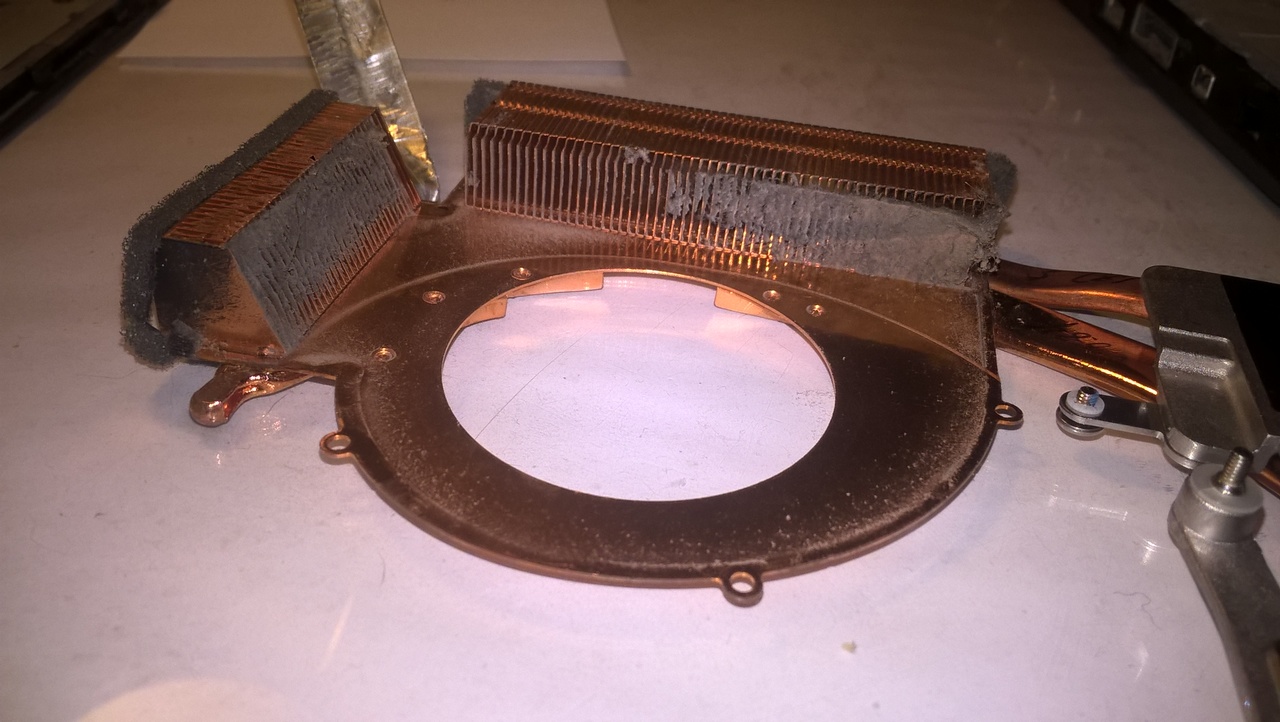
And what do you know, it wasn’t in the best shape:
- one of the two screws holding the heatsink on the GPU was completely loose (a manufacturing error)
- the thermal paste was mostly reduced to dust
- and I certainly wasn’t fan of the fan…

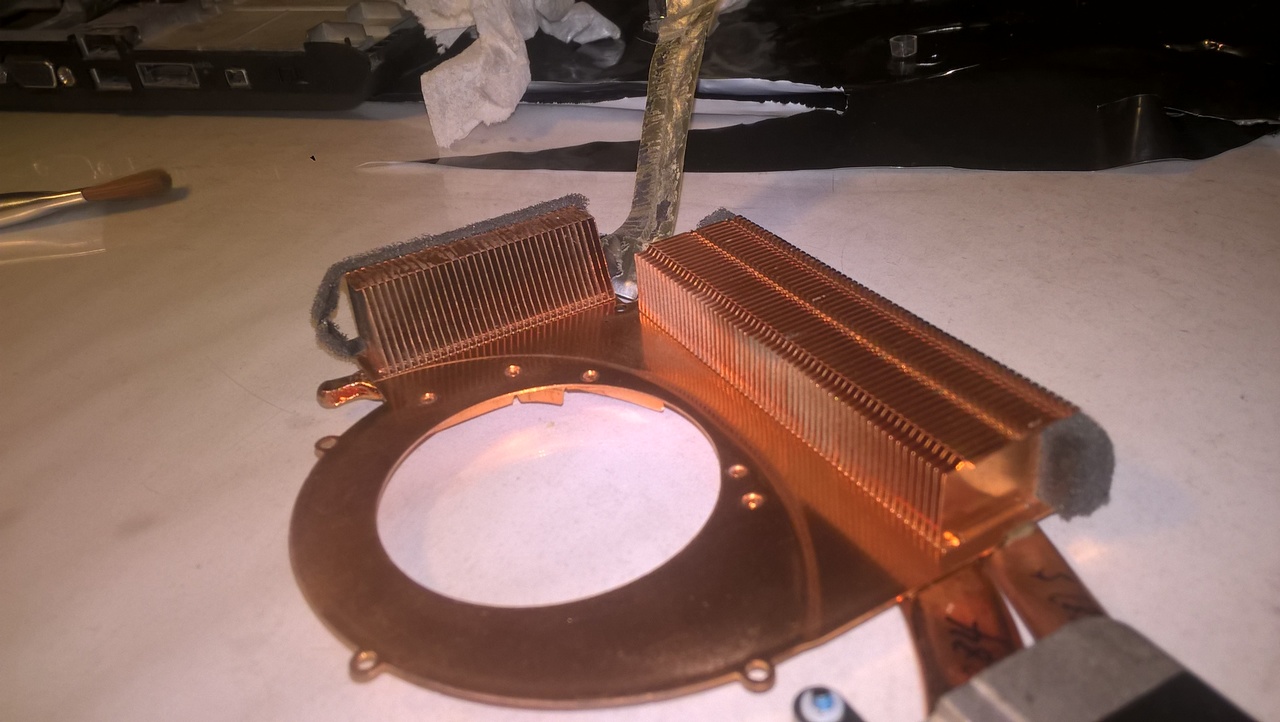
With the help of a brush and canned air I cleaned it up.

I’ve also replaced the thermal paste and assembled it all together. To my big surprise and relief not only there were no spare parts, but the machine booted up. (Apparently I’ve only incorrectly plugged in touchpad, so I will have to open it again rather soon…)
Post-analysis
With the fan finally being able to breathe, I can just launch the scripts I’ve already written and see what I will see… I just needed to change the times and labels for the plotting script.
|
|
The start/end time specification is quite rich so you can easily select particular time segments.

This is much more pleasing view!
- even on 100% it takes several minutes just to reach temperature that previously on quarter the usage would get to in a minute or so
- even prolonged maximum performance shouldn’t be an issue as the asymptote seems to be under 90°C
- the temperature drops like a rock when the CPU is not used
- previously 80°C → 55°C took 5 minutes
- now 80°C → 55°C takes just about 30 seconds
- in five minutes the temperatures is happy to drop to 45°C and below
Conclusion
In conclusion, my machine (minus the touchpad) is happy again and I can put it through its paces, also I’ve discovered a great tool for logging this kind of metrics and plotting them.
Finally, I can just keep all the files (or rather, this post) and regularly rerun the suite once or twice a year to see how it slowly deteriorates. Considering it took five years to get to this state it may be a while.
The machine also has a separate GPU unit, which I forgot about as I seldom use it. Although it should benefit from the cleanup as they share both the fan and heatsink, it seems that is somehow damaged, as putting it through the paces will still kill it. But at least it no longer shuts off from CPU load (which was the main problem).
And I am no longer terrified of taking laptops apart. :)